
1 / 3
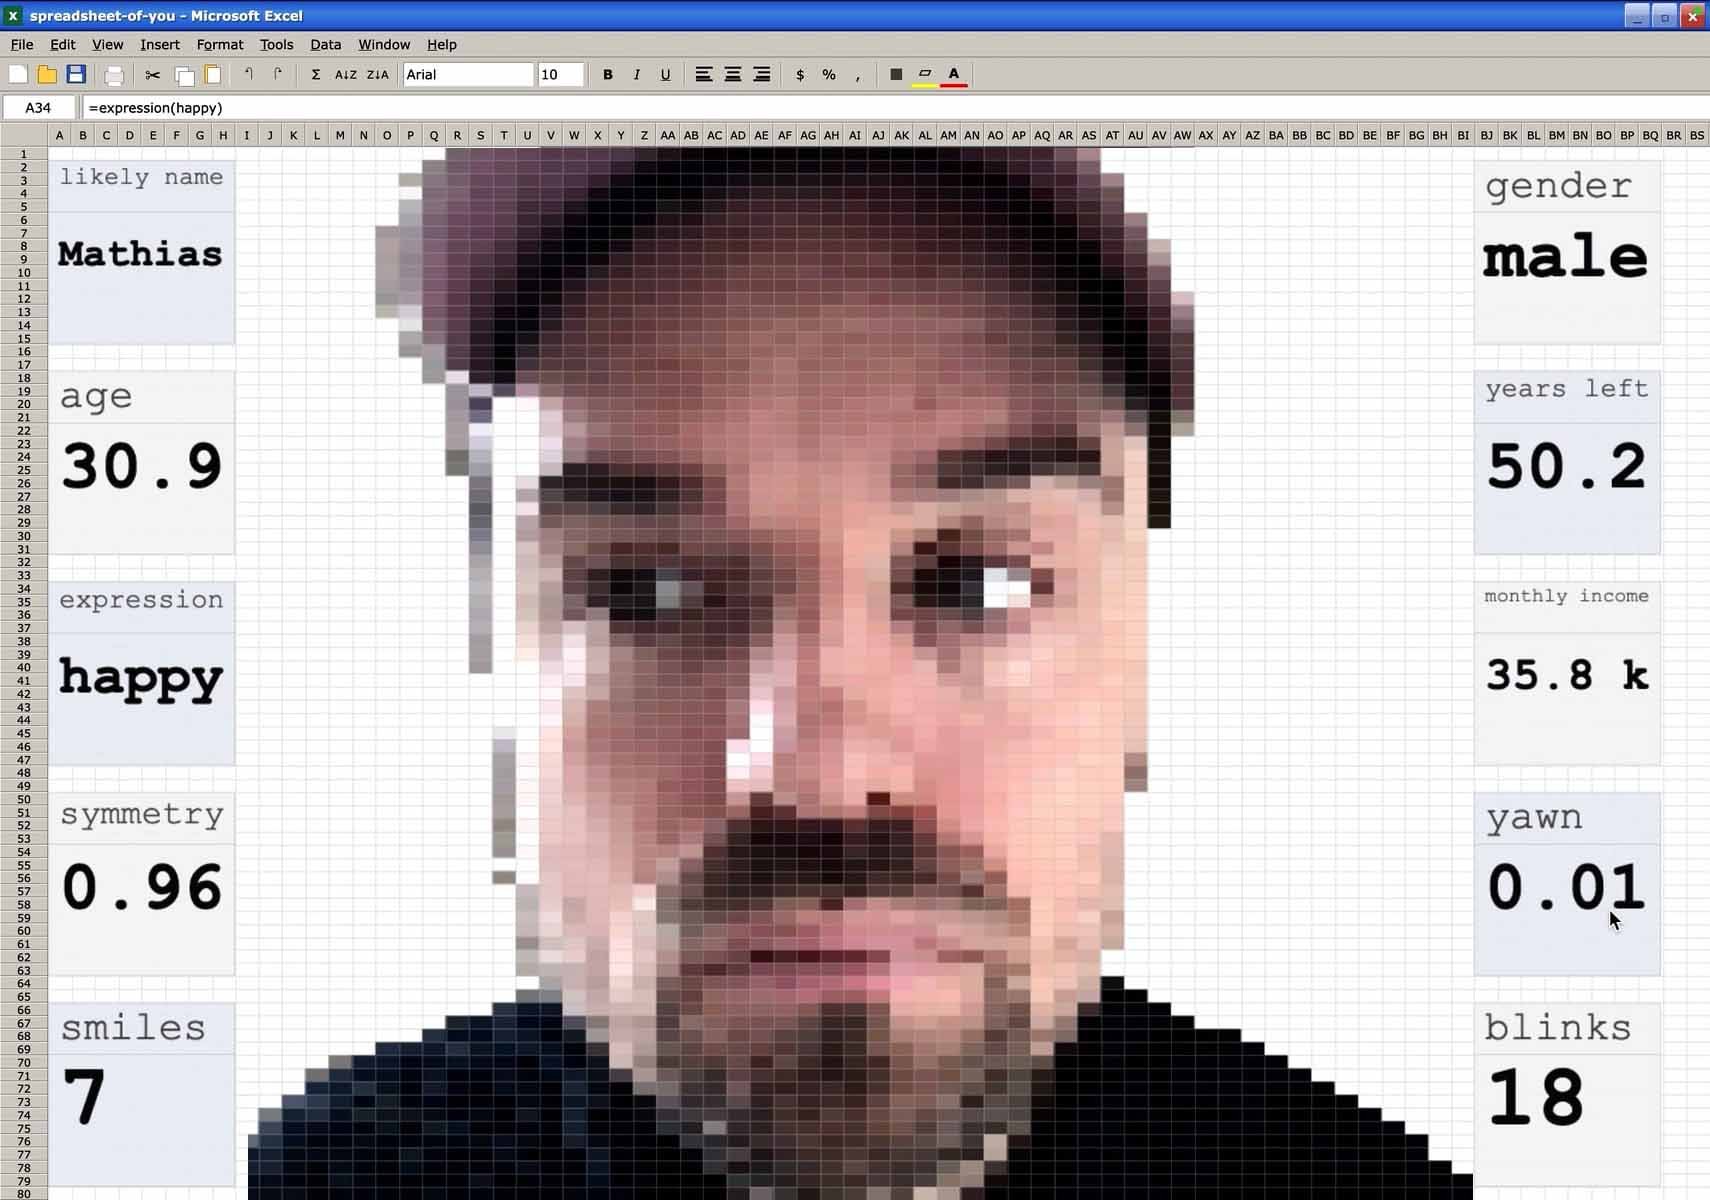
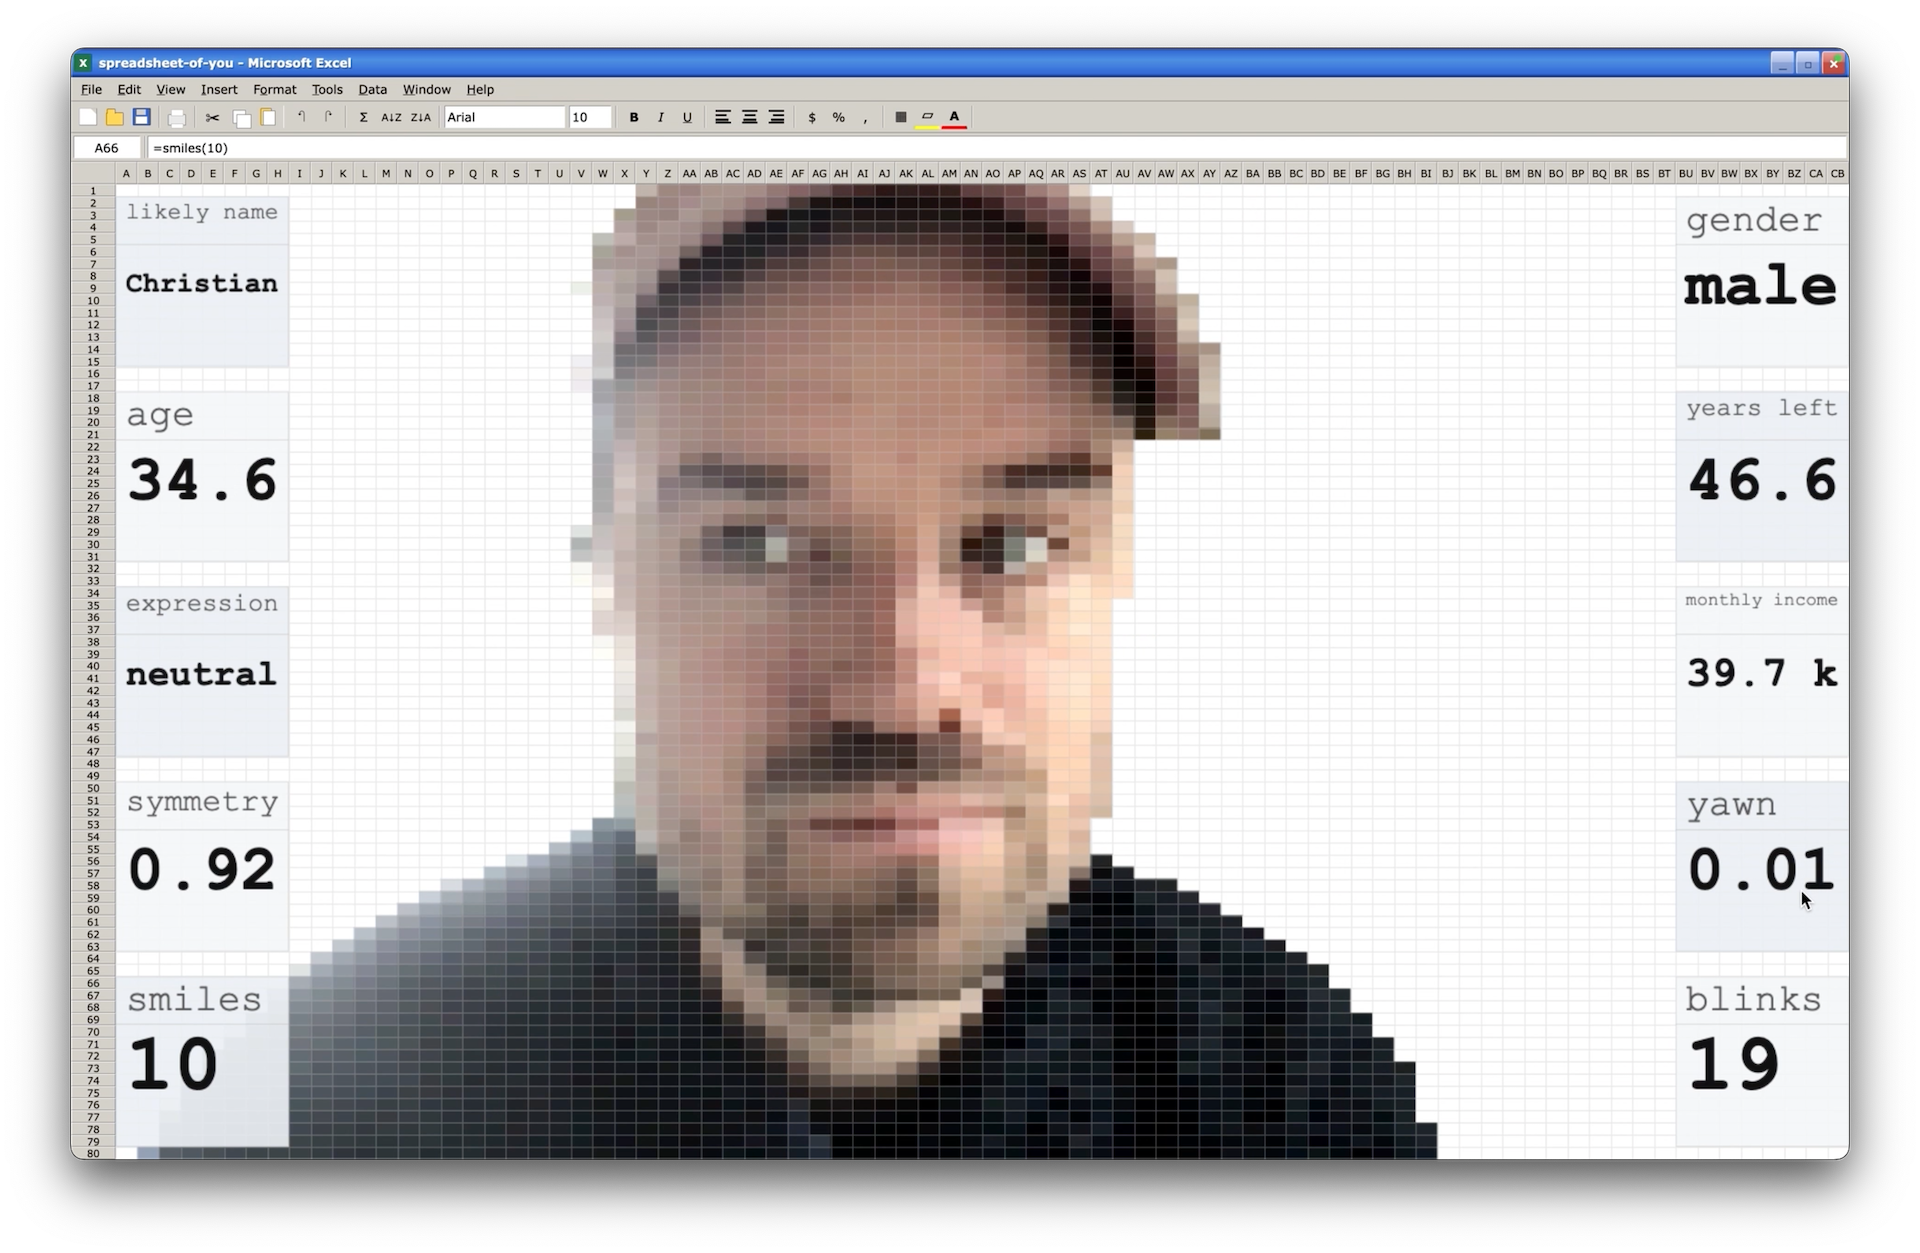
Spreadsheet of You is an interactive art installation that transforms visitors into live Excel spreadsheets. Standing before the work, a person sees themselves rendered as an 80x80 grid of colored cells — their body a white silhouette, their face a mosaic of pixels — while real-time data extracted from their appearance fills the cells around them.
What does it feel like to see yourself reduced to data? The spreadsheet is the native format of bureaucracy, insurance, HR, and surveillance capitalism. Excel 2003 is the aesthetic of an era when personal data felt mundane — before we understood what it meant to be quantified. The installation places the visitor inside that system: measured, classified, and statistically profiled using the same demographic tables that shape policy, pensions, and insurance premiums.
A camera captures the visitor and downsamples the image to 80x80 pixels — one pixel per spreadsheet cell. Three computer vision systems process the feed simultaneously:
MediaPipe FaceLandmarker tracks 468 facial landmarks and 52 blendshape scores — eye openness, mouth gape, head rotation, facial symmetry, blink patterns. MediaPipe Selfie Segmenter separates the person from the background, producing the white silhouette. face-api.js estimates age, gender, and expression (neutral, happy, sad, angry, surprised, fearful, disgusted). From the estimated age and gender, the installation looks up official data from Statistics Denmark (Denmark's national statistical authority) to calculate your most likely first name, your estimated monthly income, and your expected remaining years to live — all based on 2024 actuarial and demographic statistics.
The piece runs entirely client-side in a web browser. No personal data leaves the visitors machine.
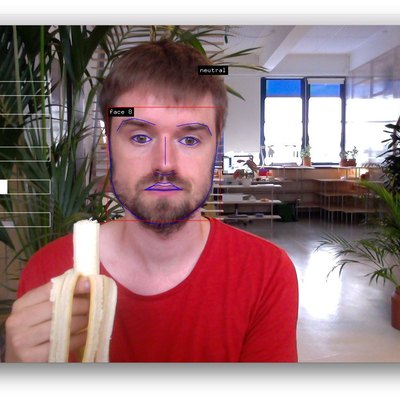
Andreas Refsgaard
Andreas Refsgaard is an artist and creative coder based in Denmark. Working in the field between art and interaction design he uses algorithms, computer vision and machine learning to explore the creative potentials of emerging digital technologies.